
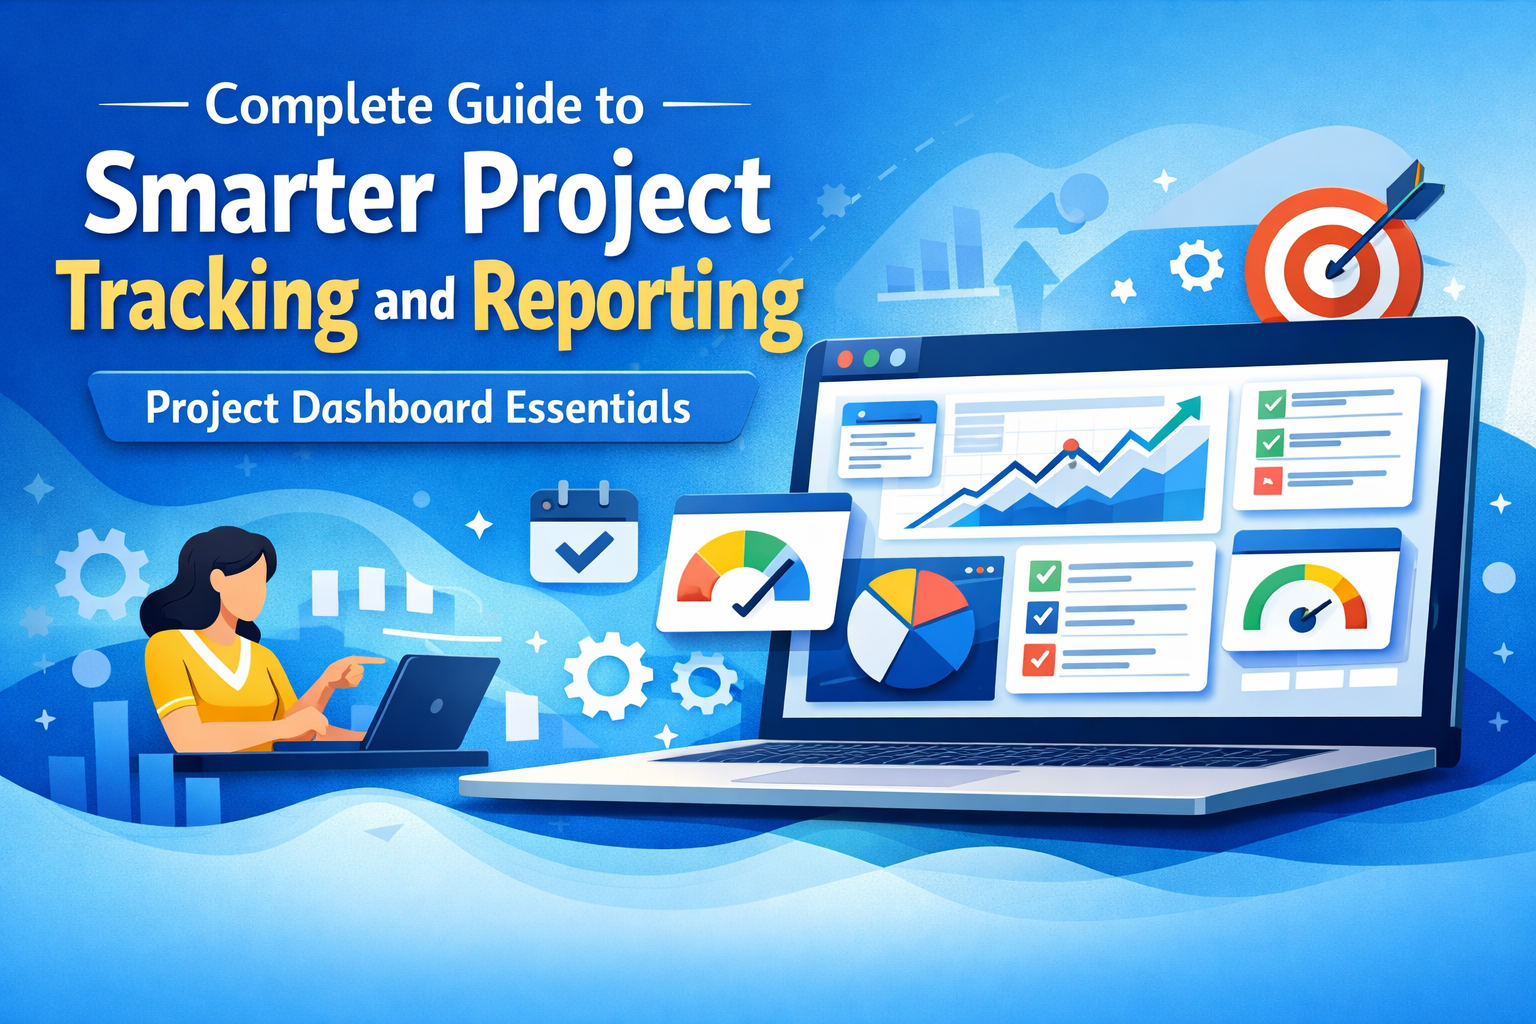
Complete Guide to Smarter Project Tracking and Reporting-Project Dashboard Essentials.
Are You Seeing Project Problems Before They Become Expensive?
Imagine discovering that your project is already weeks behind schedule or significantly over budget only after a stakeholder requests a progress update. By that stage, recovering the project often requires additional resources, revised timelines, and difficult conversations.
This situation is more common than many organizations expect. As projects grow in size and complexity, keeping track of schedules, budgets, risks, resources, and stakeholder expectations becomes increasingly challenging. When information is scattered across spreadsheets, emails, reports, and meetings, project managers spend more time searching for answers than making informed decisions.
A Project Dashboard solves this challenge by bringing all critical project information into one centralized, easy-to-understand view. Instead of reviewing multiple reports, you can instantly monitor project health, identify emerging risks, track budgets, measure progress, and prioritize the actions that matter most.
Whether you’re leading a software implementation, construction project, manufacturing initiative, infrastructure program, or business transformation, a dashboard helps everyone—from project teams to senior executives—stay aligned with real-time project performance.
What Is a Project Dashboard Template?
A Project Dashboard Template is a visual reporting tool that consolidates key project metrics into a single interactive view. Rather than presenting raw data, it transforms project information into meaningful insights using charts, graphs, KPIs, progress bars, and status indicators.
A well-designed dashboard enables project managers to answer important questions within seconds:
- Is the project on schedule?
- Are we within budget?
- Which milestones have been completed?
- What risks require immediate attention?
- How effectively are resources being utilized?
- Which issues need escalation?
By turning complex project data into actionable insights, dashboards help project teams make faster decisions, improve communication, and reduce reporting effort.
Why Every Modern Project Needs a Dashboard
Every project generates a constant flow of information. Tasks are completed, budgets change, risks emerge, stakeholders request updates, and priorities evolve. Without a structured reporting system, it becomes difficult to maintain complete visibility.
A Project Dashboard acts as the project’s control center by bringing together information from multiple sources into one reliable view.
Instead of asking, “Where is the latest report?”, project leaders can focus on more strategic questions:
- What is impacting delivery?
- Which milestones are at risk?
- Where should management intervene?
- What decisions are needed today?
This shift from searching for information to acting on information is what makes dashboards one of the most valuable tools in modern project management.
Key Benefits of Using a Project Dashboard
Organizations that implement standardized project dashboards gain several advantages:
- Real-time visibility into project performance
- Faster and more accurate reporting
- Better budget and schedule control
- Improved resource planning
- Early identification of project risks
- Stronger stakeholder communication
- Better executive decision-making
- Increased accountability across project teams
- Reduced manual reporting effort
- Higher confidence in project delivery
Rather than reacting to problems after they occur, project teams can identify trends early and take corrective action before issues affect delivery, cost, or quality.
Types of Project Dashboards Every Organization Should Know
Not all projects require the same level of reporting. An executive overseeing multiple projects needs a high-level summary, while a project manager often requires detailed insights into schedules, budgets, risks, and daily progress.
Choosing the right dashboard ensures the right people receive the right information at the right time.
Executive Dashboard
An Executive Dashboard is designed for senior leaders, sponsors, and executives who need a quick overview of project performance without reviewing operational details.
Typical metrics include:
- Overall project health
- Budget status
- Schedule performance
- Key milestones
- High-priority risks
- Critical decisions
- Portfolio summary
This dashboard enables faster strategic decision-making and supports executive reporting.
Project Manager Dashboard
A Project Manager Dashboard provides a detailed operational view of an individual project.
It commonly includes:
- Task completion
- Milestone progress
- Schedule variance
- Budget utilization
- Team workload
- Open risks
- Active issues
- Change requests
This dashboard helps project managers identify delays early and keep delivery on track.
Financial Dashboard
Financial dashboards focus on cost control and budget performance.
Key metrics include:
- Approved budget
- Actual expenditure
- Cost variance
- Forecast cost
- Remaining budget
- Earned Value (EV)
- Cost Performance Index (CPI)
- Estimate at Completion (EAC)
Finance teams and project sponsors use these dashboards to ensure projects remain financially healthy.
Resource Dashboard
Resource planning is essential for balancing workloads and maximizing productivity.
A Resource Dashboard helps managers monitor:
- Team availability
- Resource allocation
- Utilization percentage
- Capacity planning
- Equipment usage
- Contractor assignments
- Skill availability
With better visibility into resource utilization, organizations can reduce bottlenecks and improve delivery efficiency.
Schedule Dashboard
Keeping projects on schedule requires continuous monitoring.
A Schedule Dashboard typically tracks:
- Planned vs. actual progress
- Upcoming milestones
- Critical path activities
- Delayed tasks
- Baseline comparison
- Forecast completion date
- Overall completion percentage
This dashboard allows project teams to address delays before they affect major deliverables.
Risk Dashboard
Every project faces uncertainty. A Risk Dashboard helps teams identify, prioritize, and monitor potential threats.
Common elements include:
- Open risks
- High-risk items
- Risk owners
- Probability and impact scores
- Risk trends
- Mitigation status
- Financial and schedule impact
Regular risk monitoring enables proactive decision-making instead of reactive problem-solving.
Portfolio Dashboard
Organizations managing multiple projects often rely on Portfolio Dashboards to monitor overall performance.
A portfolio dashboard provides:
- Project health across programs
- Budget summaries
- Resource allocation
- Portfolio risks
- Strategic objectives
- Overall delivery performance
Executives can quickly identify projects that require attention while maintaining visibility across the entire portfolio.
Who Should Use a Project Dashboard?
Project dashboards deliver value to professionals across every level of an organization.
Common users include:
- Project Managers
- Program Managers
- Portfolio Managers
- PMO Leaders
- Construction Managers
- Engineering Managers
- Product Managers
- Delivery Managers
- Business Owners
- Department Heads
- Executive Leadership
- Clients and Sponsors
- Consultants
- Government Agencies
- Operations Teams
Whether your organization manages a single project or hundreds of initiatives, dashboards improve communication, reporting, and decision-making.
Essential Components of a Project Dashboard
A professional dashboard combines multiple reporting areas into one centralized view.
Project Overview
The dashboard should begin with high-level project information, including:
- Project name
- Project manager
- Client or sponsor
- Project phase
- Start and finish dates
- Reporting period
- Overall project status
- Business unit
- Priority level
This information provides immediate context before reviewing detailed metrics.
Schedule Performance
Schedule tracking helps determine whether the project is progressing as planned.
Include metrics such as:
- Planned completion
- Actual completion
- Schedule variance
- Activities completed
- Remaining activities
- Upcoming milestones
- Critical path tasks
- Delayed activities
- Forecast completion date
Monitoring these indicators helps project teams detect schedule risks early.
Budget Performance
Financial visibility is essential for successful project delivery.
Recommended budget metrics include:
- Original budget
- Approved budget
- Actual cost
- Forecast cost
- Remaining budget
- Cost variance
- Budget utilization
- Cash flow
- Earned Value (EV)
- Cost Performance Index (CPI)
A well-designed financial dashboard enables faster corrective action before cost overruns become significant.
Resource Performance
Projects succeed when the right people are available at the right time.
Track:
- Team utilization
- Assigned hours
- Available capacity
- Department workload
- Contractor allocation
- Equipment availability
- Resource constraints
Effective resource planning improves productivity while preventing burnout and scheduling conflicts.
Advanced Project Dashboard Components That Drive Better Decisions
As projects become more complex, managers need more than a simple progress chart. They need dashboards that provide real-time insights into quality, procurement, stakeholder engagement, change requests, safety, and overall project performance.
Let’s explore the advanced dashboard components that help organizations deliver projects successfully.
Quality Dashboard
Quality is a critical measure of project success. Delivering on time and within budget means little if the final output doesn’t meet customer expectations.
A Quality Dashboard gives project managers instant visibility into quality performance by tracking:
- Completed quality inspections
- Passed and failed inspections
- Defects and non-conformities
- Rework activities
- Punch list items
- Customer complaints
- Audit findings
- Corrective and preventive actions
- Overall quality score
Monitoring these indicators helps teams identify recurring issues, improve processes, and reduce costly rework.
Procurement Dashboard
Procurement plays a major role in projects involving vendors, subcontractors, equipment, or materials.
A Procurement Dashboard helps monitor purchasing activities from request to delivery.
Typical metrics include:
- Purchase orders
- Material deliveries
- Vendor performance
- Supplier ratings
- Contract status
- Invoice tracking
- Payment status
- Material availability
- Procurement progress
- Late deliveries
Having procurement data available in one place allows project teams to respond quickly to supply chain disruptions and maintain project schedules.
Stakeholder Dashboard
Strong stakeholder communication is essential for project success.
A Stakeholder Dashboard helps managers understand engagement levels and monitor key approvals.
Important metrics include:
- Stakeholder satisfaction
- Pending approvals
- Meeting attendance
- Communication status
- Outstanding decisions
- Client feedback
- Escalations
- Approval turnaround time
- Engagement level
This visibility helps maintain alignment between project teams, sponsors, clients, and executive leadership.
Change Management Dashboard
Project changes are inevitable, but uncontrolled changes often lead to budget overruns and schedule delays.
A Change Dashboard tracks:
- Approved changes
- Pending requests
- Rejected changes
- Cost impact
- Schedule impact
- Priority level
- Approval status
- Change trends
This enables project managers to evaluate the effect of each change before implementation and maintain control over project scope.
Safety Dashboard
For construction, manufacturing, and infrastructure projects, safety reporting is just as important as schedule and budget tracking.
Common safety indicators include:
- Lost Time Incidents (LTI)
- Near misses
- Safety observations
- Safety inspections
- Training completion
- Corrective actions
- Compliance status
- Accident reports
A safety dashboard promotes proactive risk management and supports regulatory compliance.
Environmental Dashboard
Many organizations now include sustainability metrics within project reporting.
An Environmental Dashboard can monitor:
- Carbon emissions
- Energy consumption
- Water usage
- Waste management
- Environmental incidents
- Compliance status
- Permit tracking
- Sustainability initiatives
Tracking environmental performance helps organizations meet corporate sustainability goals while reducing environmental risks.
Key Performance Indicators (KPIs) Every Dashboard Should Track
KPIs transform project data into actionable insights.
Every effective Project Dashboard Template should include measurable indicators such as:
- Project completion percentage
- Schedule Performance Index (SPI)
- Cost Performance Index (CPI)
- Budget variance
- Schedule variance
- Milestone completion rate
- Resource utilization
- Risk exposure
- Issue resolution time
- Customer satisfaction score
- Procurement performance
- Change request volume
Reviewing these KPIs regularly enables project teams to identify trends early and make better-informed decisions.
Best Charts to Include in a Project Dashboard
Data becomes easier to understand when presented visually.
Some of the most effective dashboard visualizations include:
- Project progress charts
- Budget trend graphs
- Schedule performance charts
- Milestone trackers
- Gantt chart summaries
- Resource utilization charts
- Risk heat maps
- Issue trend graphs
- Cash flow reports
- KPI scorecards
- Department comparison charts
- Forecast dashboards
The goal isn’t to display more charts—it’s to display the right charts that support faster decisions.
Dashboard Automation: Save Time and Improve Accuracy
Modern dashboards should reduce manual reporting rather than create additional work.
Useful automation features include:
- Automatic KPI calculations
- Dynamic charts
- Pivot tables
- Interactive slicers and filters
- Conditional formatting
- Drop-down selections
- Automated summaries
- Connected worksheets
- Data validation
- Real-time updates
Automation minimizes reporting errors and allows project managers to focus on analysis instead of data collection.
Dashboard Design Best Practices
A successful dashboard is designed for decision-making, not decoration.
Follow these best practices:
- Keep the layout clean and uncluttered.
- Prioritize the most important KPIs.
- Use consistent colors throughout the dashboard.
- Highlight exceptions instead of every data point.
- Avoid unnecessary charts.
- Make information easy to scan.
- Use interactive filters where appropriate.
- Update data regularly.
- Ensure reports load quickly.
- Keep navigation simple.
A well-designed dashboard should answer key project questions within seconds.
Common Dashboard Mistakes to Avoid
Even powerful reporting tools lose their value when they become difficult to use.
Avoid these common mistakes:
- Displaying too much information
- Using inconsistent colors
- Tracking metrics without business value
- Allowing outdated data to remain visible
- Creating complex formulas that are difficult to maintain
- Ignoring mobile or executive readability
- Duplicating information across multiple reports
- Building dashboards without automation
Remember, a dashboard should simplify project management—not make it more complicated.
Real-World Example: How a Project Dashboard Improves Decision-Making
Imagine a construction company managing a $50 million hospital project involving hundreds of workers, multiple contractors, suppliers, and thousands of individual tasks.
Without a centralized dashboard, project managers might spend hours collecting updates from spreadsheets, emails, and meetings before producing a status report. By the time the information reaches decision-makers, it may already be outdated.
Now imagine the same project using a live Project Dashboard Template.
At a glance, executives can review:
- Overall project completion percentage
- Schedule Performance Index (SPI)
- Cost Performance Index (CPI)
- Budget utilization
- High-priority risks
- Open issues
- Upcoming milestones
- Resource utilization
- Procurement status
If the Schedule Performance Index drops below the agreed threshold, the dashboard immediately highlights the issue. If costs begin trending above budget, finance teams can investigate before the overrun becomes significant.
Instead of reacting after problems occur, the team responds while there is still time to influence the outcome.
The Future of Project Dashboards
Project dashboards continue to evolve alongside modern technology.
Today’s organizations are moving beyond static reports toward intelligent dashboards that provide real-time insights and predictive analytics.
Modern dashboard capabilities increasingly include:
- AI-assisted forecasting
- Predictive schedule analysis
- Automated risk alerts
- Real-time collaboration
- Cloud-based reporting
- Interactive drill-down reports
- Mobile accessibility
- Automated KPI updates
- Executive scorecards
As projects become more complex, intelligent dashboards will play an even greater role in helping organizations make faster, data-driven decisions.
Frequently Asked Questions
What is a Project Dashboard Template?
A Project Dashboard Template is a centralized reporting tool that displays key project metrics—such as schedule, budget, milestones, risks, issues, and KPIs—in a single visual interface.
Why is a Project Dashboard important?
A dashboard provides real-time visibility into project performance, enabling teams to identify risks early, improve communication, and make informed decisions without reviewing multiple reports.
What should every Project Dashboard include?
An effective dashboard should include:
- Project overview
- Schedule performance
- Budget tracking
- Resource utilization
- Risk and issue summaries
- Milestone progress
- KPI scorecards
- Stakeholder updates
- Change requests
Which industries benefit from Project Dashboards?
Project dashboards are widely used across construction, information technology, manufacturing, healthcare, engineering, government, education, logistics, and consulting.
Can Excel be used to create a Project Dashboard?
Yes. Microsoft Excel remains one of the most popular tools for building customizable project dashboards using Pivot Tables, charts, conditional formatting, formulas, and slicers.
Final Thoughts
Successful projects rely on timely information, informed decisions, and effective communication. A Project Dashboard Template brings these elements together by transforming complex project data into meaningful insights that everyone can understand.
Rather than spending valuable time searching for reports or manually compiling updates, project teams can focus on what truly matters—delivering projects successfully.
Whether you’re managing a single initiative or an enterprise portfolio, a well-designed dashboard improves transparency, strengthens accountability, supports better governance, and enables proactive decision-making.
The best dashboards don’t just report project status—they help project managers anticipate challenges, prioritize actions, and deliver consistent results.
Call to Action
Looking to improve project visibility and reporting?
Start with a professionally designed Project Dashboard Template that helps you monitor schedules, budgets, resources, risks, and KPIs from one centralized location.
A well-structured dashboard can save reporting time, improve stakeholder communication, and help your team deliver projects with greater confidence.