

If you walk into any boardroom and ask for “the project plan,” chances are you’re going to see a Gantt chart.
Why are they so universal? Because they turn a messy list of tasks into a clear, visual story. A well-built Gantt chart answers the five biggest questions in project management instantly:
- What are we building?
- When does it start and finish?
- Who is doing what?
- What happens if this task is late?
- Are we on track?
In this guide, we’re going to walk through everything you need to know. You’ll learn how to read them confidently, how to build them step-by-step (even in Excel), and the common pitfalls that trip up even experienced managers.
Let’s turn complexity into clarity.
What is a Gantt Chart?
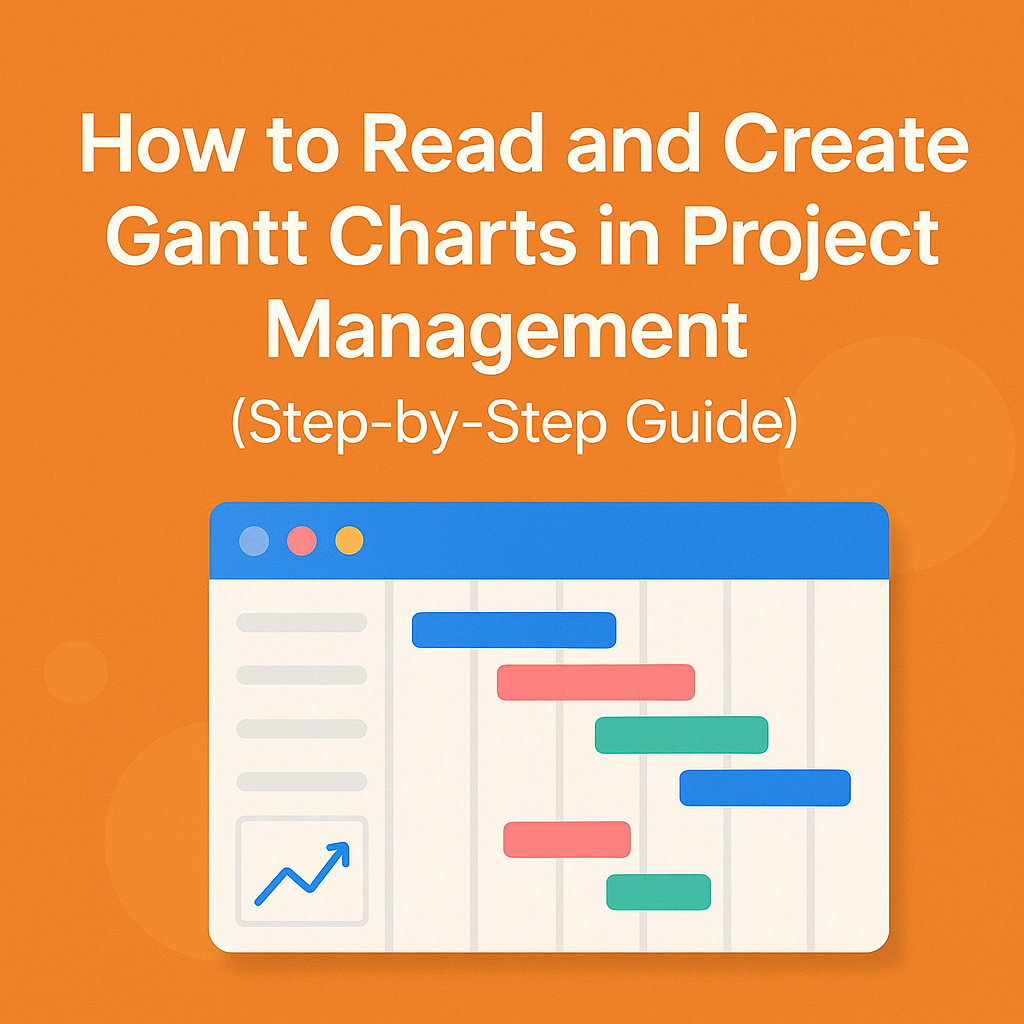
At its core, a Gantt chart is a visual timeline of your project. It lists your tasks on the left and spreads them across a calendar at the top.
The main ingredients are:
- Tasks: The specific work to be done.
- Timeline: The calendar (days, weeks, months).
- Bars: The horizontal blocks showing the start, end, and duration of each task.
- Dependencies: The lines or arrows showing which tasks need to finish before others can start.
- Milestones: The diamond shapes representing key dates or deliverables.
Popularized by Henry Gantt in the early 1900s, this tool remains the gold standard for scheduling in industries like construction, IT, and manufacturing.
How to Read a Gantt Chart (In 5 Steps)
Looking at a complex chart for the first time can be intimidating. Here is a simple way to dissect any project schedule:
- Find the Finish Line: Look at the very first task and the very last task. That span is your total project duration.
- Follow the Flow: Scan the major phases (like Planning, Design, Build, Test). This tells you the story of the project.
- Spot the “Critical Path”: Look for the chain of tasks that cannot be delayed. These are usually highlighted in red. If one of these slips, your project end date slips.
- Check the Connections: Look at the arrows between bars. Does the logic make sense? You can’t paint the wall before you build it.
- Scan for Diamonds: Milestones (approvals, sign-offs) are the checkpoints. If they are missing, the project lacks governance.
How to Create a Gantt Chart (The Professional Way)
You can use fancy software like Microsoft Project or Primavera P6, but the logic remains the same. Here is how to build a schedule that actually works:
Step 1: Lock Down the Scope
Don’t touch a timeline until you know exactly what you are delivering. A vague scope creates a broken schedule.
Step 2: Break It Down (WBS)
Create a Work Breakdown Structure (WBS). Break the final deliverable into smaller, manageable pieces. Think of it as creating the skeleton before adding the muscles.
Step 3: List Every Task
Turn those work packages into actionable tasks. Instead of “Handle Website,” write “Design Homepage Mockup” or “Develop Checkout Module.” Every task needs to be assignable.
Step 4: Estimate Time (Realistically)
Use historical data or expert opinions. Avoid the trap of guessing just to make the boss happy. Be honest about how long things take.
Step 5: Map the Dependencies
Connect the dots. Ask: “What has to happen before this task can begin?” This creates your project flow.
Step 6: Set the Baseline
Once everyone agrees on the plan, “save” or “baseline” the schedule. This is your target. From now on, you track variance (how far off target you are).
Building a Simple Gantt Chart in Excel
Don’t have expensive software? No problem. Excel can handle small to medium projects.
- Create a table with Task Name, Start Date, End Date, and Duration.
- Insert a Stacked Bar Chart.
- Format the chart so the first bar (the start date) is invisible, leaving only the duration bars visible.
It’s a quick hack that works for team presentations.
5 Common Gantt Chart Mistakes
Even experienced PMs fall into these traps. Avoid them to stay credible:
- The “Kitchen Sink” Mistake: Putting 1,000 tiny tasks on one chart. It becomes unreadable. Create summary views for executives and detailed views for teams.
- The Floating Task List: Drawing bars but forgetting to link them with dependencies. This isn’t a schedule; it’s a wish list.
- False Optimism: Assuming everything will go perfectly. Build in buffers.
- The Wall Decoration: Creating the chart at the start and never updating it. A stale Gantt chart is worse than no chart.
- Ignoring Workloads: Just because two tasks can happen at the same time doesn’t mean the same person can do them both. Check resources!
When to Use a Gantt Chart
Gantt charts shine when the stakes are high and the plan is complex. They are perfect for:
- Construction projects
- Software development (at the roadmap level)
- Event planning
- Product launches
However, they are less ideal for:
- Highly exploratory research (where you don’t know what you don’t know).
- Small, informal teams that operate on rapid, daily priority changes.
- Pure Agile environments (where Kanban boards work better for daily flow).
The Agile Twist
Wait, do Agile teams use Gantt charts? Yes. Even if the development team uses a Scrum board, leadership usually needs a Gantt-style roadmap to understand how this sprint fits into the yearly quarter.
Final Thoughts: Clarity is Power
A Gantt chart is more than just colored bars. It is a communication tool, a risk register, and a control mechanism rolled into one. When built correctly, it transforms chaos into clarity. Master this skill, and you stop being just a task-tracker—you become a true project leader.